What is the critical path in simple terms?
The critical path is the longest chain of dependent activities in a project schedule. It determines the earliest possible project completion date.
11/03/2026 - Articles
Which activities determine whether your project finishes on time? The critical path reveals where delays put the completion date at risk and where scheduling flexibility remains. Follow a practical example to learn how to calculate it using the Critical Path Method (CPM), assess float, and take targeted action to keep your project on schedule.
The critical path is the longest continuous sequence of dependent activities in the project schedule. It determines the earliest possible project completion.
In a simple CPM network diagram, critical activities have zero total float.
The critical path is calculated using a forward pass, a backward pass, and a comparison of early and late dates.
A project can have multiple critical paths. Activities with limited float also deserve attention.
The calculation is only as reliable as the estimated durations, dependencies, calendars, and constraints behind it.
The critical path is the longest sequence of logically dependent activities from project start to completion. It determines the shortest possible project duration under the conditions defined in the schedule. What matters is the duration of this sequence, not the number of activities it contains: Even a few dependent activities can determine when the project finishes.
The calculation method is called the Critical Path Method (CPM) and is a network scheduling technique. It combines estimated activity durations with the dependencies between activities. This makes it possible to calculate when each activity can start at the earliest and must finish at the latest. Because some activities can run in parallel, the project duration does not equal the sum of all activity durations.
In a simple CPM model without additional date constraints, activities on the critical path have zero total float. If one of these activities takes longer than planned, the earliest possible project completion is delayed unless that delay is offset. The critical path therefore reveals where schedule deviations directly affect project completion. This information supports scheduling, project control, and the assessment of schedule impacts in risk management.
A clear project activity plan is essential: Which activities are required, how long do they take, and which preceding activities must be completed first? Assigning specific dates to these activities produces a project schedule. Dependencies must be explicitly defined. The position of a bar in a Gantt chart alone does not establish whether the next activity actually depends on its completion.

The critical path answers the question: Which sequence of activities determines the earliest possible project completion? Section 3.8 of ISO 21502:2020 defines the critical path, in essence, as the sequence of activities that determines the earliest possible completion date for a project or phase.
In the context of the critical path, “critical” describes an activity’s impact on the project schedule. It does not indicate the activity’s technical importance, cost, or risk. A complex development activity may have float, while a brief approval can determine the project completion date.

A product launch requires both technical acceptance and completed training materials. The materials can be finished earlier and still have float. Technical acceptance, however, takes place immediately before approval to launch. Although it takes only a few hours, a delay can push back the entire launch date. The training materials remain essential to project success, even if they are initially noncritical in the schedule.
This raises two distinct questions for project managers:
Which activities need attention to meet the project completion date?
Which tasks are essential for quality, safety, or the agreed scope?
The critical path answers the first question. Answering the second also requires an assessment of technical requirements, risks, costs, and available resources. Positive float is therefore no reason to omit a task or compromise its quality.
Float, also called slack, describes an activity’s scheduling flexibility within the calculated project schedule. The amount of float depends on activity durations, dependencies, and date constraints. Total float and free float answer different questions: How does a delay affect project completion? And at what point does it affect subsequent activities?
Total float (TF) indicates how far an activity can be delayed from its earliest scheduled position without delaying project completion or violating a governing date constraint. The earliest dates of its successors may already shift within this allowance. The project completion date can still be met.

Total float = late start − early start
Alternatively:
Total float = late finish − early finish
In a simple CPM model without additional date constraints, zero total float identifies critical activities. A positive value indicates available scheduling flexibility. Negative total float means that the calculated dates are incompatible with a specified target date or another date constraint. It therefore signals a need for corrective action in the schedule.
Free float (FF) indicates how far an activity can be delayed from its earliest scheduled position without delaying the early start of any immediate successor. If an activity has multiple successors, the one with the earliest start determines the available free float.
FF = earliest ES of immediate successors − EF of the activity
This simple formula assumes a shared working calendar. For other dependency types, leads or lags, or different calendars, the calculation must be adjusted accordingly.
Example: An activity has five days of total float but only two days of free float. If it is delayed by two days, its successors’ early start dates remain unchanged. A three-day delay forces at least one successor to start later. The project completion date can still be met because the total float has not been fully consumed.
Zero free float therefore does not automatically mean “critical.” An activity can directly delay its successor and still have total float. In a simple CPM model, total float determines whether an activity is critical.
Float along an activity sequence must not simply be added together. Multiple activities may share the same scheduling flexibility. If a predecessor consumes part of that float, correspondingly less remains for its successors.
Total float is calculated from the project schedule. A contingency reserve is deliberately included to account for uncertainty. Positive total float alone therefore does not indicate whether a project is adequately protected against schedule risks.
To calculate the critical path, you need a complete activity list with estimated durations and the predecessors of each activity. Use this information to build a network diagram, then perform a forward pass followed by a backward pass. Comparing early and late dates reveals the available float and identifies the activity sequences that determine project completion.
The following worked example uses only finish-to-start relationships with zero lag: A successor can start as soon as all its predecessors are complete. Calculations use a shared working calendar and workdays measured from time 0. An activity that starts at 0 and lasts three workdays therefore finishes at time 3. Weekends and holidays are not shown separately. Resource constraints and additional fixed dates are excluded from the calculation.
Duration and effort are different measures: Activity duration is the time an activity occupies in the schedule. Effort is the amount of work required, typically measured in person-hours. The following CPM calculation uses activity durations.
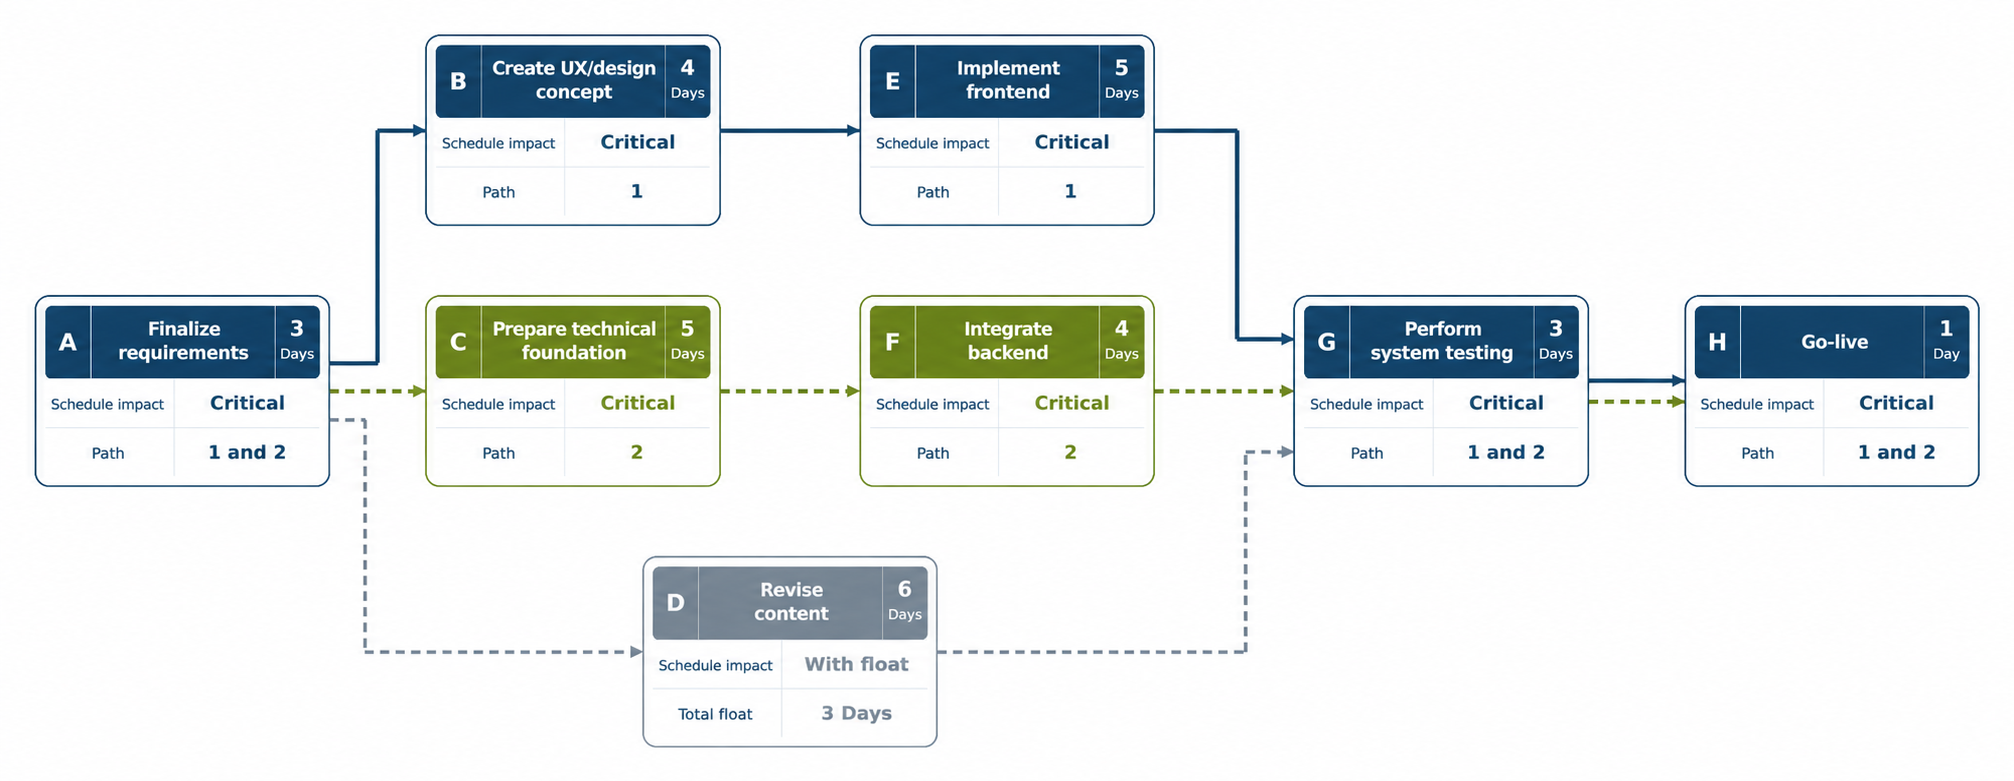
For a website relaunch, the requirements must first be finalized. Design, technical preparation, and content revision can then begin in parallel. Frontend implementation depends on the design concept, while backend integration depends on the technical foundation. System testing starts only when the content, frontend, and backend are ready. Go-live follows.
| Activity | Work | Duration | Predecessors | Schedule impact |
|---|---|---|---|---|
| A | Finalize requirements | 3 days | – | Path 1Path 2 Critical |
| B | Create UX and design concept | 4 days | A | Path 1 Critical |
| C | Prepare technical foundation | 5 days | A | Path 2 Critical |
| D | Revise content | 6 days | A | 3 days of total float |
| E | Implement frontend | 5 days | B | Path 1 Critical |
| F | Integrate backend | 4 days | C | Path 2 Critical |
| G | Perform system testing | 3 days | D, E, F | Path 1Path 2 Critical |
| H | Go-live | 1 day | G | Path 1Path 2 Critical |
Three branches run in parallel after A. G can start only when D, E, and F are complete. The latest finish among these predecessors determines G’s early start. Result: There are two equally long critical paths: A–B–E–G–H and A–C–F–G–H. Both determine the project duration of 16 workdays. Activity D is also important but has 3 workdays of total float.
The forward pass begins at project start and follows the dependencies through to project completion. It determines the early start (ES) and early finish (EF) of each activity, assuming that every activity starts as early as possible.
EF = ES + duration
For activities with multiple predecessors:
ES = latest EF of immediate predecessors
Activity A starts at time 0 and lasts three workdays: EF(A) = 0 + 3 = 3. B, C, and D can therefore start at time 3 at the earliest. Their durations determine their early finishes: B finishes at 7, C at 8, and D at 9. E then finishes at 12 after another five days; F also finishes at 12 after another four days.
The three branches converge at activity G. System testing must wait for all immediate predecessors: D, E, and F. The latest of their early finishes therefore determines its start: ES(G) = max(9, 12, 12) = 12. The three-day testing activity finishes at 15. The subsequent one-day go-live activity H brings the shortest possible project duration to 16 workdays.
The backward pass begins at project completion and follows the dependencies back to the start. It determines the late finish (LF) and late start (LS) of each activity without delaying the calculated project completion. In this example, the latest project finish is set to the previously calculated time of 16.
LS = LF − duration
For activities with multiple successors:
LF = earliest LS of immediate successors
H must finish at 16 and therefore start no later than 15. G must consequently be complete by 15. With a duration of three days, its late start is LS(G) = 15 − 3 = 12. D, E, and F must therefore all finish no later than 12.
This produces different late starts: With a duration of six days, D can start no later than 6; E, lasting five days, no later than 7; and F, lasting four days, no later than 8. Continuing backward, B and C must both start no later than 3.
A has three immediate successors: B, C, and D. Their late starts are 3, 3, and 6. To prevent any of them from starting late, A must finish by the earliest of these values: LF(A) = min(3, 3, 6) = 3. With a duration of three days, this again gives LS(A) = 0.
The results of both passes are now compared. Total float is the difference between late and early start, or between late and early finish:
TF = LS − ES = LF − EF
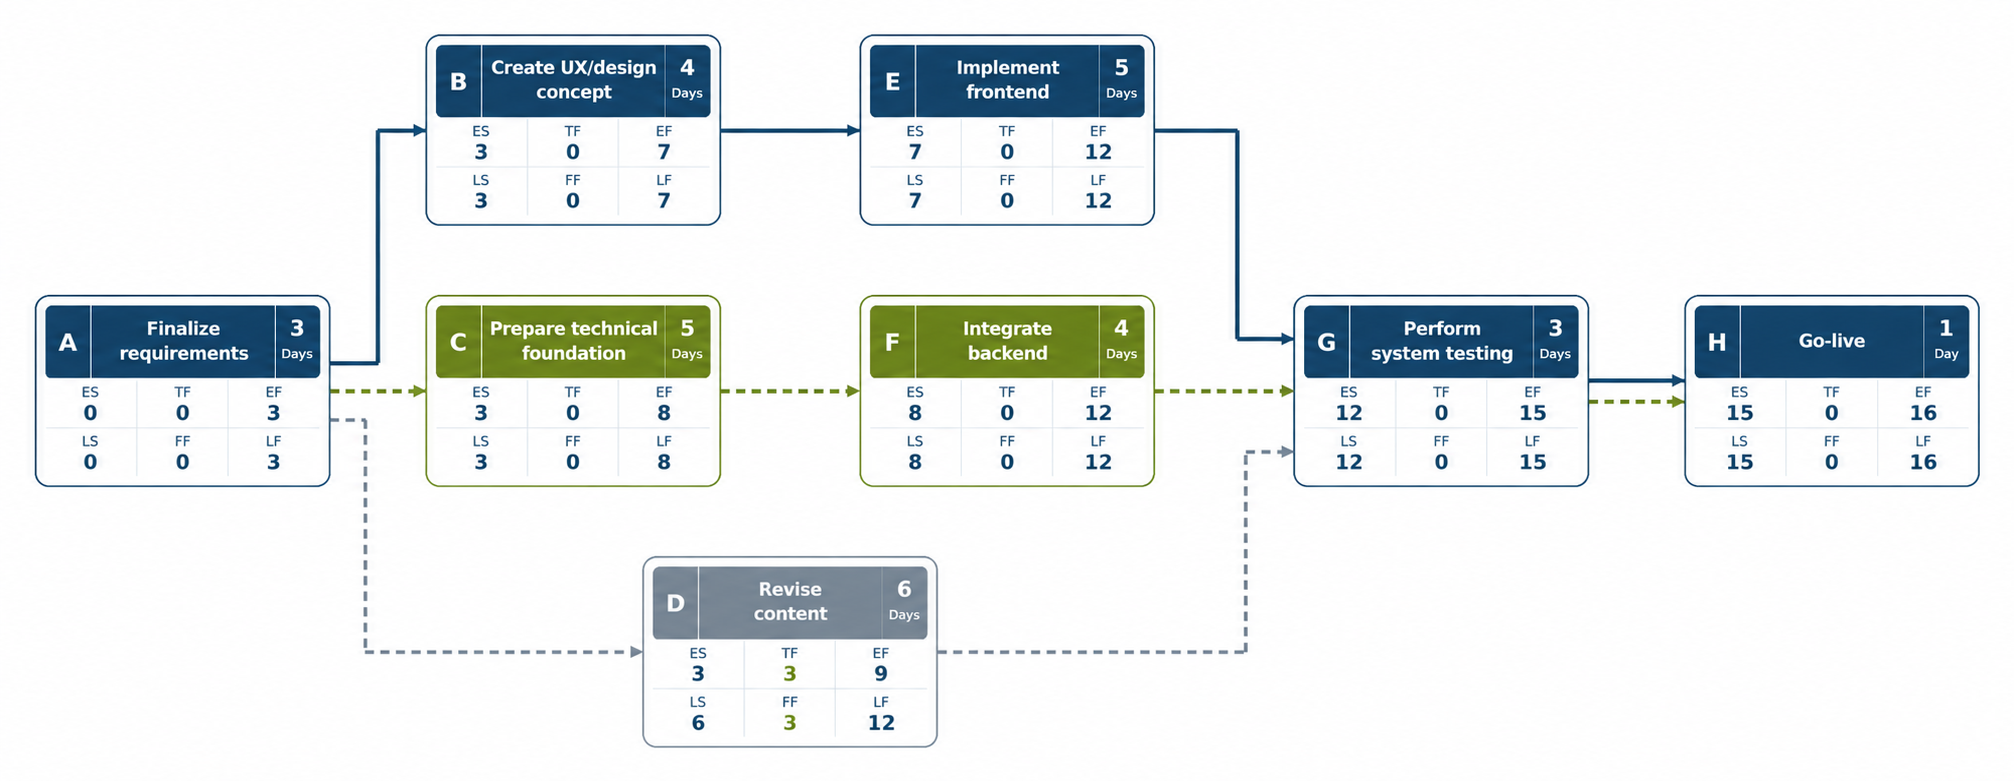
For D: TF(D) = 6 − 3 = 3 workdays. D can therefore start up to three workdays later without delaying project completion. For E, however, early and late start are identical: TF(E) = 7 − 7 = 0. The following overview shows the calculated values for all activities. The continuous sequences of dependent activities with zero total float form the critical paths.
| Activity | ES | EF | LS | LF | Total float |
|---|---|---|---|---|---|
| A | 0 | 3 | 0 | 3 | Path 1Path 2 0 days |
| B | 3 | 7 | 3 | 7 | Path 1 0 days |
| C | 3 | 8 | 3 | 8 | Path 2 0 days |
| D | 3 | 9 | 6 | 12 | 3 days |
| E | 7 | 12 | 7 | 12 | Path 1 0 days |
| F | 8 | 12 | 8 | 12 | Path 2 0 days |
| G | 12 | 15 | 12 | 15 | Path 1Path 2 0 days |
| H | 15 | 16 | 15 | 16 | Path 1Path 2 0 days |
How to read the table: Activities with zero total float lie on a critical path. A, G, and H belong to both critical paths: A–B–E–G–H and A–C–F–G–H. Activity D has three days of total float.
The calculation identifies two critical paths. Each activity sequence takes 16 workdays, determining the earliest possible project completion:
A → B → E → G → H: 3 + 4 + 5 + 3 + 1 = 16 workdays
A → C → F → G → H: 3 + 5 + 4 + 3 + 1 = 16 workdays
A, G, and H belong to both critical paths. Between A and G, the design and frontend branch runs in parallel with the technical foundation and backend branch. Their durations are therefore not added together: System testing activity G must wait until both branches and content revision are complete.
The path A → D → G → H, by contrast, totals 3 + 6 + 3 + 1 = 13 workdays. This is three workdays shorter than the project duration. D can use this flexibility before its completion delays system testing. If the float is fully consumed and the rest of the schedule remains unchanged, a third critical path emerges.

The forward pass determines early dates.
The backward pass determines late dates.
The difference between late and early dates gives the total float.
How does a change in activity duration affect project completion? The following three scenarios show how to use CPM calculation results to make scheduling decisions. Each scenario starts from the original schedule with a project duration of 16 workdays. All other durations and dependencies remain unchanged.
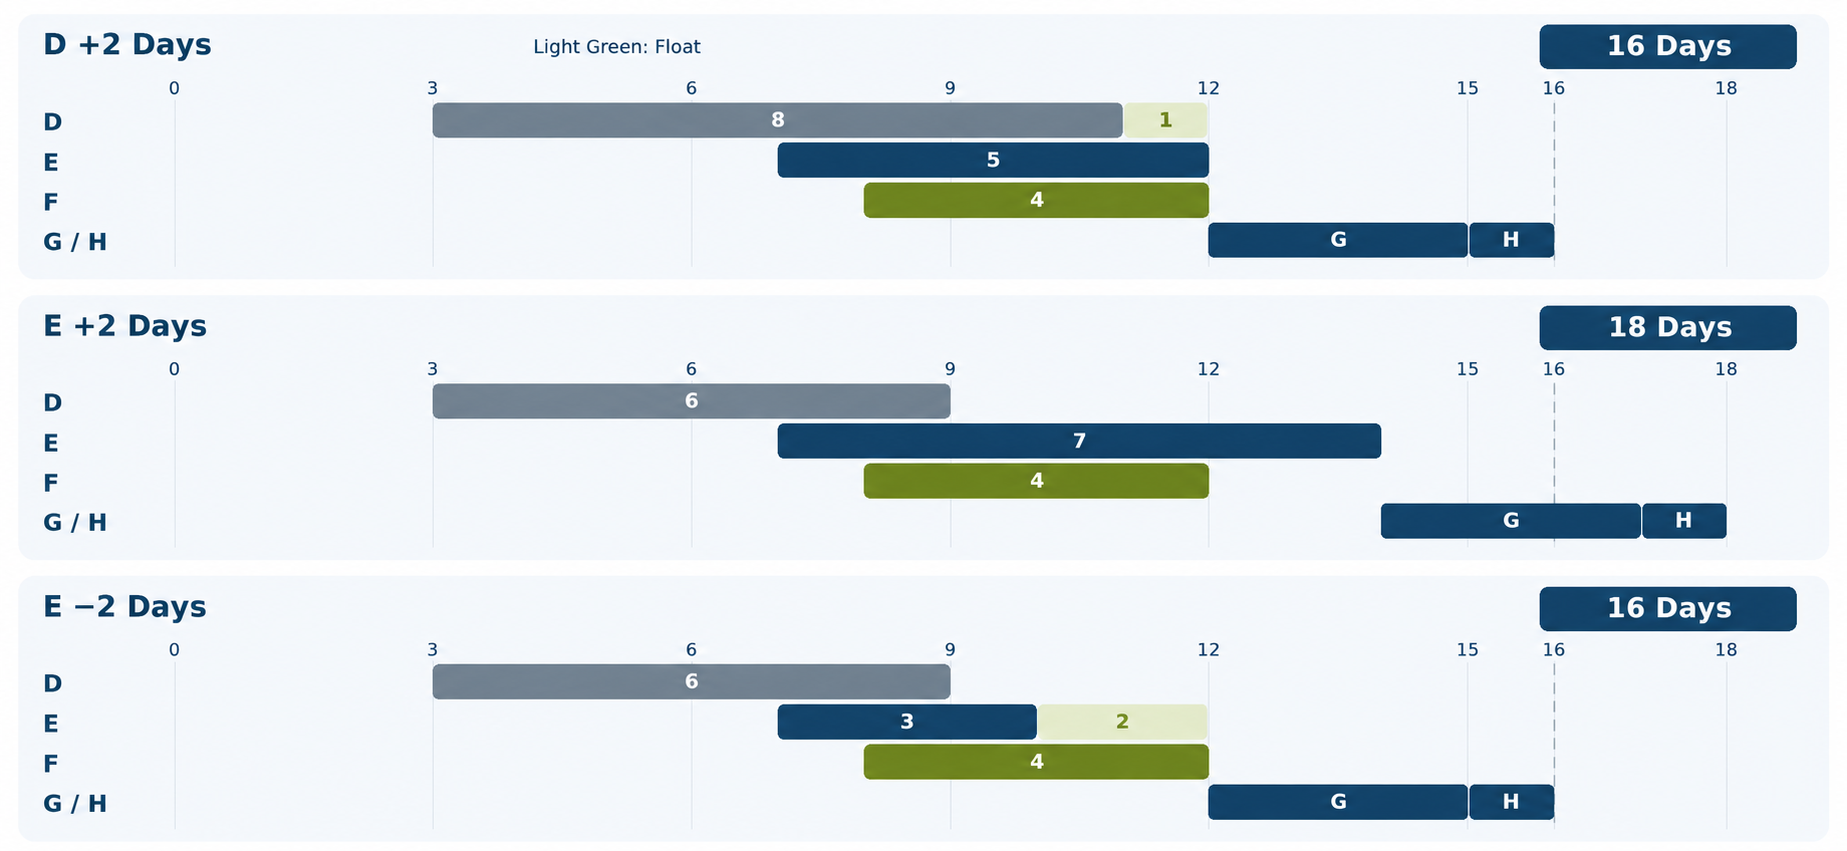
Content revision activity D takes eight workdays instead of six. With its start unchanged at time 3, it now finishes at 11 instead of 9. System testing activity G can still start at 12, since frontend activity E and backend activity F are not complete until then. Project completion remains at 16 workdays; D’s total float decreases from three workdays to one.
For project managers: The delay does not yet affect the completion date. However, less scheduling flexibility remains: If D takes even longer, this branch could also become critical.
Frontend implementation activity E takes seven workdays instead of five, finishing at 14 instead of 12. G cannot start until 14 and finishes at 17. The subsequent go-live activity H pushes project completion to 18 workdays. Only the path A → B → E → G → H now determines the project duration.
For project managers: To meet the original completion date, a total of two workdays must be saved along the path that is now longest. Accelerating only the backend branch through F would not offset E’s delayed completion.
Frontend implementation activity E takes three workdays instead of five, finishing at 10 instead of 12. G must still wait until 12 because backend activity F is not ready before then. Project completion remains at 16 workdays. The path A → C → F → G → H remains critical; E gains two workdays of total float.
For project managers: Finishing earlier creates flexibility in the frontend branch but does not shorten the overall project. An earlier project finish would also require shortening the backend branch that remains critical or accelerating a shared activity such as system testing.
Change the activity durations in the website relaunch example or select one of the three scenarios. The Gantt chart and schedule values update automatically, showing which activities determine project completion, how much float remains, and whether your changes affect the project duration.
Each of the three scenarios starts from the original schedule. You can combine your own changes.
| Activity | Duration | Predecessors | ES | EF | LS | LF | TF | FF | Status |
|---|
ES / EF: early start / early finish. LS / LF: late start / late finish. TF: total float. FF: free float.
Forward pass: EF = ES + duration; ES = latest EF of predecessors. Backward pass from the calculated project finish: LS = LF − duration; LF = earliest LS of successors. TF = LS − ES. FF = earliest ES of successors − EF. For the final activity, project completion is used as the successor date.
Model: fixed finish-to-start relationships with zero lag, a shared working calendar, and whole-number durations from 1 to 60 workdays. Resource constraints, holidays, and additional date constraints are not considered. All calculations run locally in your browser. The calculator itself does not store or transmit any inputs.
The critical path changes as the project progresses. During execution, the key question is which remaining activities determine the forecast completion date. The schedule must therefore reflect the actual project status: completed activities, work in progress, and estimated remaining durations. Recalculate the critical path as part of regular status updates and after significant changes.
A progress figure alone is not enough to produce a reliable completion forecast. “80 percent complete” does not automatically mean that only 20 percent of the originally planned duration remains. Outstanding reviews, questions, or rework may take longer than expected. Ask specific questions:
What work remains?
What is blocking progress?
How many workdays will likely be needed to finish?
Also update any changes to dependencies, available working hours, and external dates. Then compare the recalculated completion date with the approved baseline. The baseline preserves the agreed schedule and makes deviations visible. Overwriting it after every delay would eliminate the ability to compare the current schedule with the original plan.
Near-critical activities and paths have very little total float. Even small delays can make them critical. There is no universal threshold: One remaining workday of float means something different for a brief approval than for a development activity lasting several weeks with an uncertain remaining duration.
Set appropriate monitoring thresholds, such as a number of workdays or a percentage of activity duration. Also track float consumption over time: An activity whose float drops from five days to one deserves attention even if it is not yet critical. PMI likewise recommends checking changes in total float and free float when updating the schedule.
When a delay is likely, first identify the cause. Missing information requires different measures than a technical failure or an overloaded key team member. Also check whether the people needed for critical work are actually available. Activities that could theoretically run in parallel offer little benefit if the same person must perform both.
Address four questions in the status meeting:
Which date is at risk?
What action will be taken?
Who is responsible for it?
When will its effectiveness be reviewed?
This makes the critical path a basis for well-supported project control decisions. Recalculating the schedule shows whether a measure is sufficient.
To finish a project earlier or recover from a delay, consider two schedule compression techniques: crashing and fast tracking. Both aim to shorten project duration without changing the project scope. Start with an updated schedule that shows which activities currently determine the completion date.
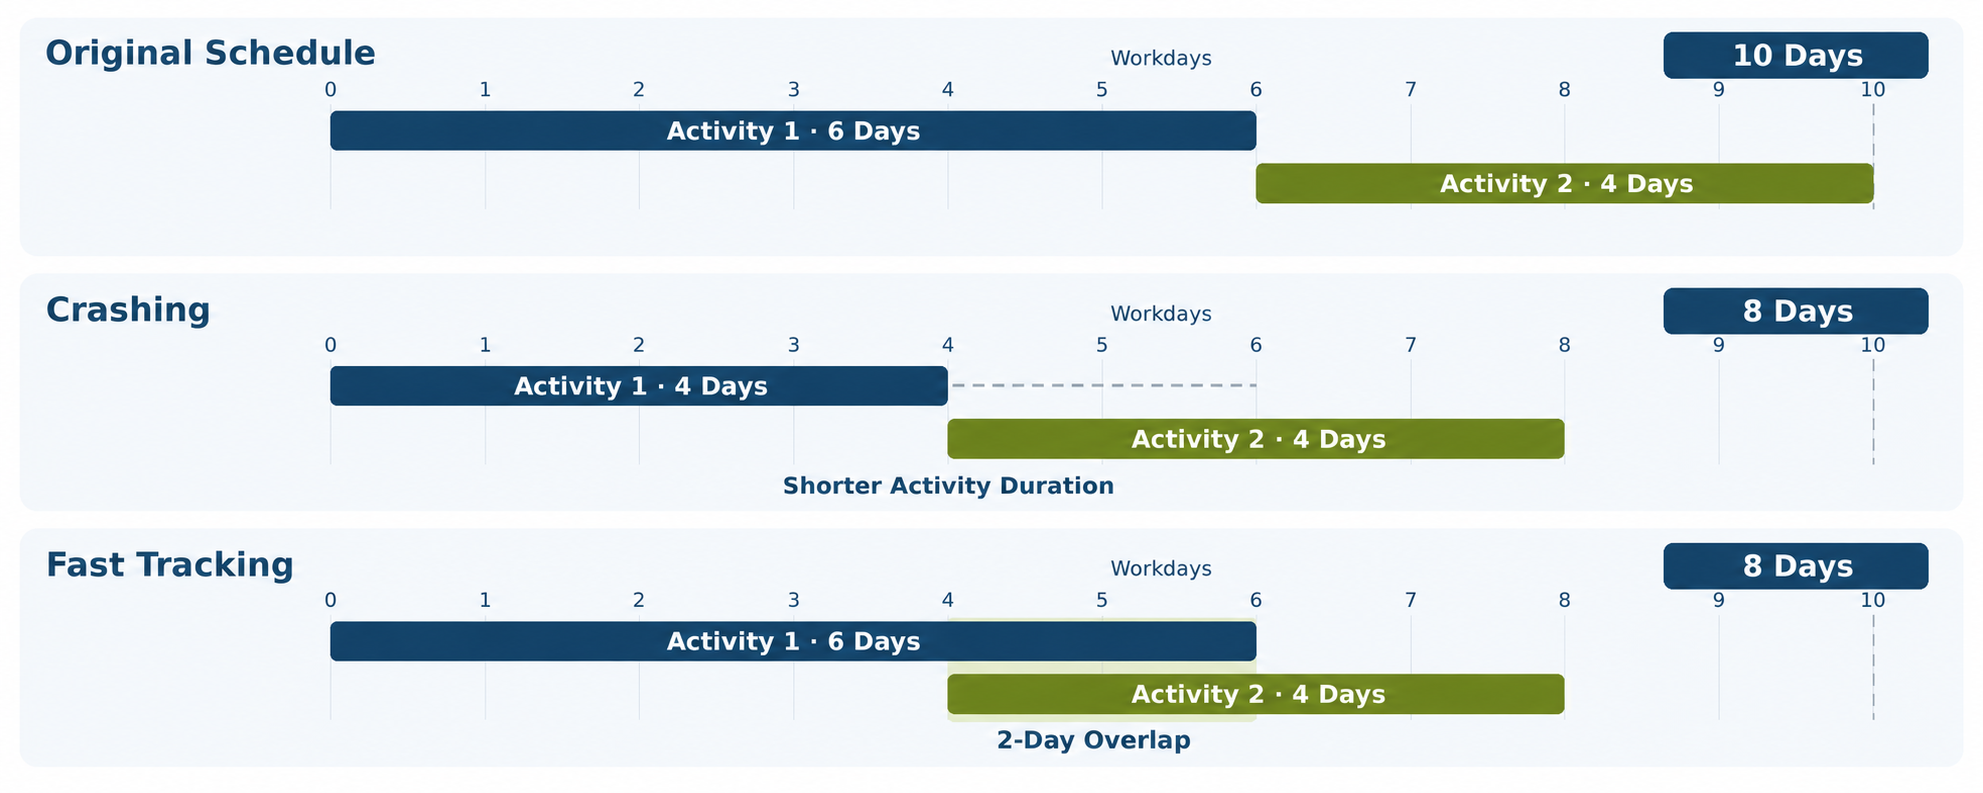
Crashing shortens an activity’s duration by adding resources. Examples include:
External specialists
Additional testing capacity
More powerful technical equipment
The sequence of activities generally remains unchanged. Additional costs are common.
Adding people does not automatically shorten duration. The work must be suitable for division among team members, and additional staff may need onboarding. A regulatory processing period or a technically necessary waiting period usually cannot be shortened by adding people. Assess how much time a measure will actually save and the additional cost per workday saved.
To shorten the overall project, the measure must affect the paths currently determining project completion. Recalculate the schedule after each change: A previously shorter path may become the new limiting factor, requiring further acceleration elsewhere.
Fast tracking involves performing work entirely or partially in parallel that was originally scheduled in sequence. Time is saved by changing the activity sequence and overlap. Individual activity durations do not have to decrease.
Example: The team starts implementing approved frontend components while the design of other pages is still being finalized. The available partial deliverables must be sufficient for meaningful work to begin. Dependencies that are essential for functional or technical reasons cannot simply be removed.
Overlapping activities increases the risk of rework: If fundamental design decisions change later, components already implemented may need adjustments. Define which partial deliverables are approved, which assumptions still apply, and who approves changes. Additional coordination and potential rework can offset the expected time savings.
Before deciding, compare the achievable project completion date, additional costs, resource requirements, and quality risks. Crashing and fast tracking can be combined. Recalculate the schedule to determine whether the combination allows you to meet the target completion date.
The Critical Path Method (CPM), Critical Chain Project Management (CCPM), and agile approaches have different priorities. CPM and CCPM support scheduling and project control. Agile approaches also address how teams develop and review results incrementally and adapt them to changing requirements.
The Critical Path Method identifies the critical path based on activity durations and logical dependencies. In its basic form, it assumes that the resources required for the calculated sequence are available. If two parallel activities require the same specialist, for example, a schedule based solely on logical dependencies may not be feasible in practice.
The critical chain also accounts for these resource dependencies. If activities must be performed in sequence because they require the same resource, this constraint is incorporated into the schedule. Critical chain planning also consolidates safety allowances into a project buffer to protect the completion date and feeding buffers where noncritical activity sequences join the critical chain. Buffer consumption provides a signal for project control.
A resource-based schedule is not automatically a critical chain schedule. CPM-based planning can also be supplemented with resource leveling. CCPM combines resource considerations with its own buffer approach and rules for managing work, such as limiting multitasking.
Agile teams refine their work incrementally and adjust their plans as new information emerges. A detailed activity sequence covering the entire development effort would therefore often become outdated quickly. Even agile projects, however, have dependencies outside the team, such as external suppliers, security assessments, system integrations, or mandatory acceptance dates.
Example: A team develops an application iteratively. Before release, however, an external security assessment and the operator’s approval must be completed. A CPM analysis can show the latest date by which a testable version must be available and which subsequent steps determine the release date.
In hybrid projects, an overall project schedule can therefore be combined with agile team planning. The schedule captures committed deliverables, handoffs, and external dependencies. The team continues to plan the implementation within its iterations. Regularly aligning both planning levels is essential to keep the overall schedule based on current forecasts.
Network diagrams and Gantt charts show the same project workflow from different perspectives:
The network diagram emphasizes dependencies between activities.
The Gantt chart shows their timing and duration.
Both views can display the critical path when they use the same calculated schedule logic.
In an activity-on-node network diagram, each box represents an activity. Arrows show the dependency relationships. In addition to the activity name and duration, nodes can contain early and late dates and float values, as shown in this article’s worked example.
This makes it particularly easy to understand where parallel branches begin, which activities depend on one another, and where results must come together. This is useful when reviewing the activity plan: If a required approval is missing as a predecessor, for example, the schedule may show work starting too early.
A node’s position and size do not necessarily correspond to its timing or duration. A longer arrow does not automatically indicate a longer time interval.
In a Gantt chart, each activity appears as a bar on a shared timeline. Its position shows the planned start and finish; its length represents its duration. This makes it easy to see when parallel activities and upcoming milestones are scheduled. A linked Gantt chart also displays the dependencies between activities.
This view is particularly useful for status meetings. Project managers can:
Highlight critical activities
Compare planned dates with the current status
Explain schedule changes
Visual indicators should be clear, using a legend or labeled highlights, for example. Color alone does not explain whether a bar is critical, delayed, or simply selected.
A separate network diagram is not essential for day-to-day work. Project management software can calculate dependencies in the background and display the results in the Gantt chart. Our article on project activity plans and Gantt charts explains how activity lists, network diagrams, and bar charts relate to one another.
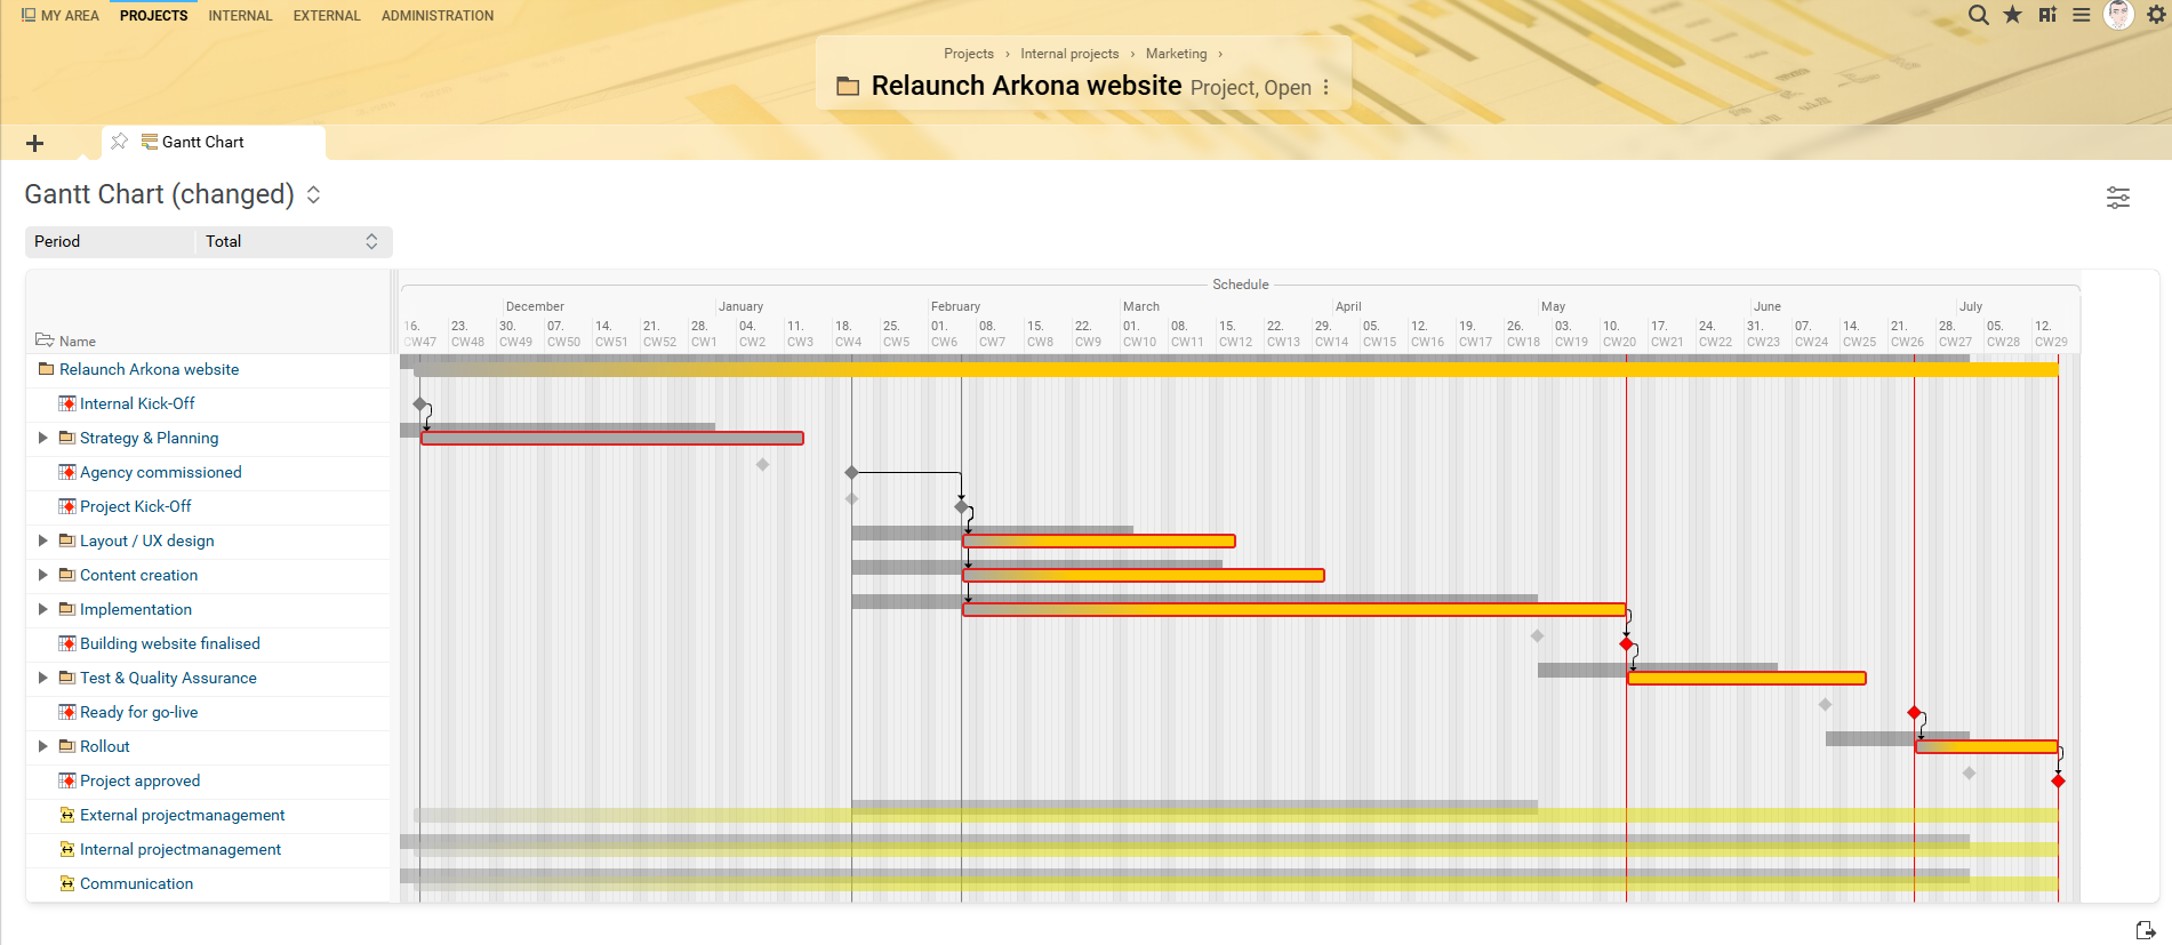
With project planning in BCS, project managers can identify which activities determine the planned project completion date. BCS calculates the critical path based on planned durations and dependencies and highlights the corresponding bars in the interactive Gantt chart. Adjustable float thresholds also let you highlight activities with limited scheduling flexibility.
In BCS, you can save different versions of your plan as baselines and compare them. For example, preserve the approved schedule as a reference while updating the current schedule. This keeps the originally agreed dates visible and shows how the schedule has changed since approval.
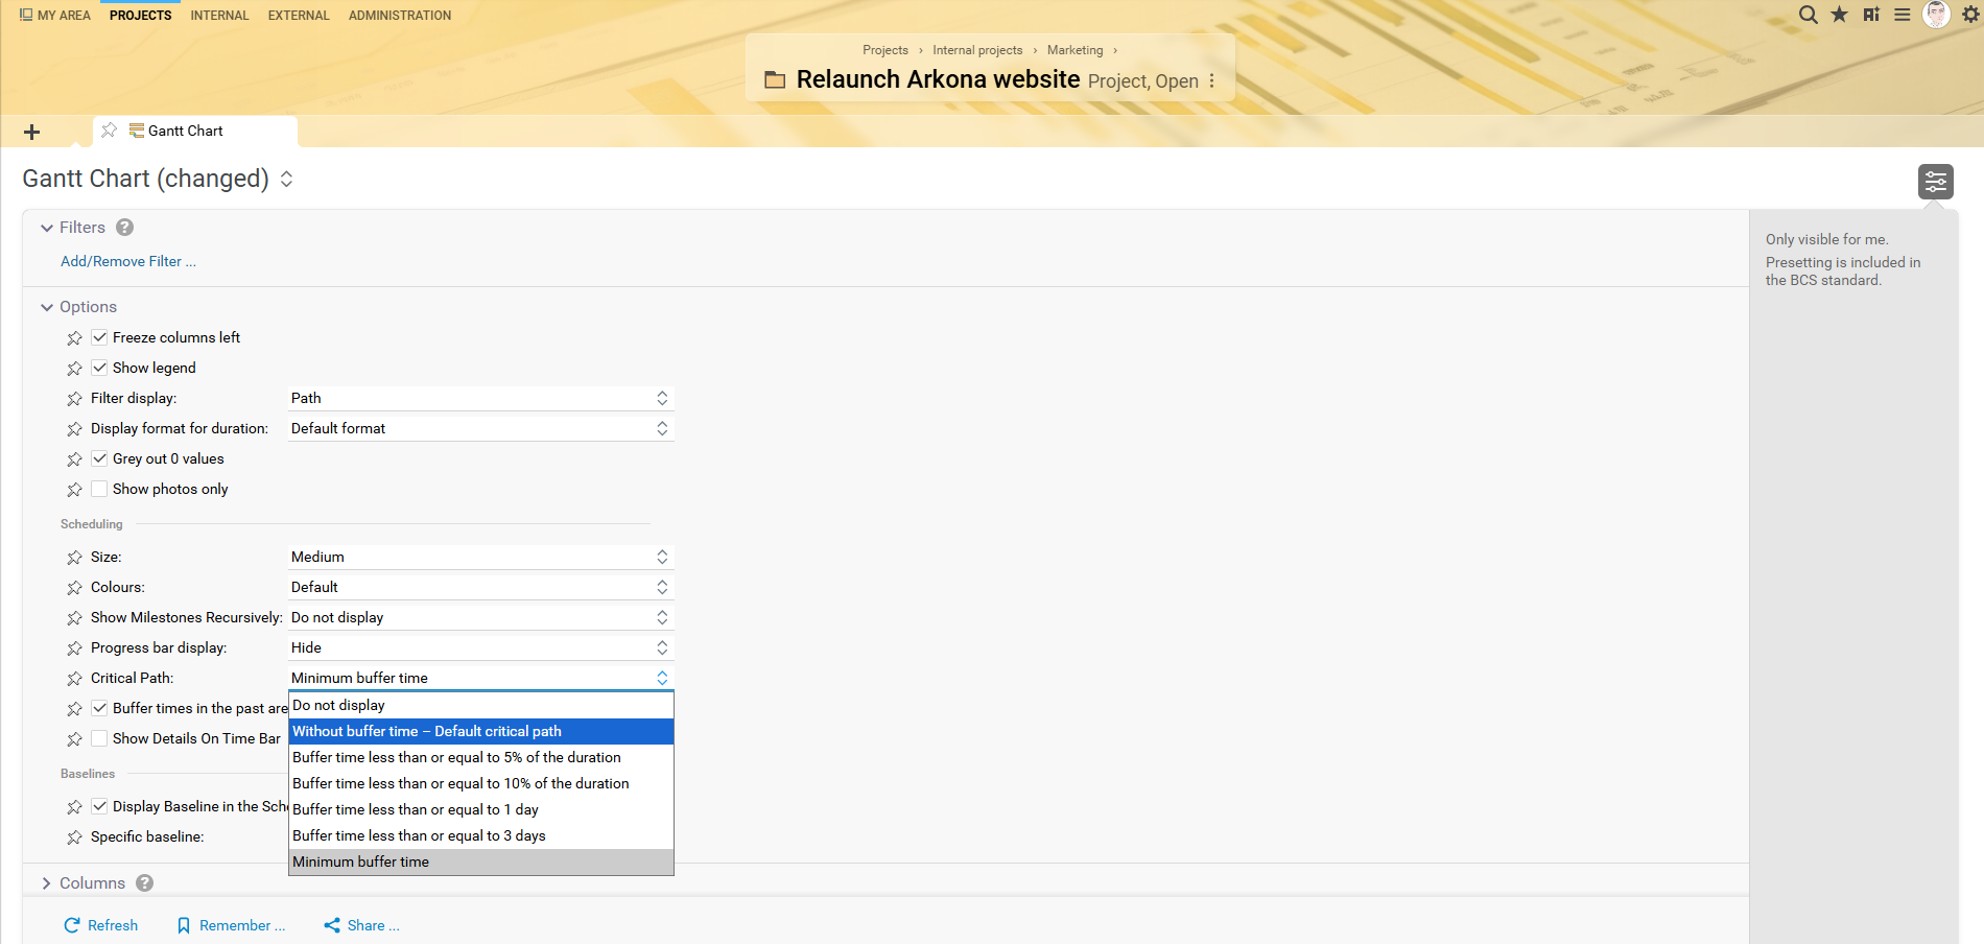
The baseline comparison and the current critical path answer two different questions:
Where does the current schedule differ from the agreed baseline?
Which activity sequence determines the currently forecast project completion date?
Together, they provide a basis for project control and agreement on necessary measures.
Project managers can assess schedule deviations and focus on the activities currently determining project completion. This helps them decide where additional support or changes to the activity sequence may be useful.
Project team members can see the dependencies between their activities and identify which subsequent work is waiting for their results. This helps them prepare handoffs and coordinate more effectively.
Clients and other stakeholders gain a clear basis for status discussions: Which dates have changed, how does this affect project completion, and where does scheduling flexibility remain?
The page on IPMA and GPM also explains how BCS supports structured project planning with automatic scheduling and critical path visualization.
The critical path is the longest chain of dependent activities in a project schedule. It determines the earliest possible project completion date.
List the activities, durations, and dependencies. A forward pass determines the earliest dates, and a backward pass determines the latest dates. In a simple CPM model, activities with zero total float lie on a critical path.
ES stands for early start, EF for early finish, LS for late start, and LF for late finish. These values are calculated using the forward and backward passes through the network diagram.
Total float shows how much an activity can be delayed without delaying the project completion date or violating a relevant schedule constraint. Free float shows how much it can be delayed before affecting the early start of an immediate successor.
Yes. If multiple activity chains have the same duration and zero total float, the project has multiple critical paths. A delay on any of these chains can jeopardize the project completion date.
Near-critical activities or paths have very little total float. They are not yet critical, but even a small delay can make them critical. They should therefore be monitored.
No. What matters is the longest logically linked chain of activities, not the longest individual bar. Without correctly defined and maintained dependencies, a Gantt chart cannot reliably identify the critical path.
Negative total float means that the calculated schedule cannot meet a specified schedule constraint or target date. Review durations, dependencies, assumptions, and dates, and agree on corrective action.
Update it whenever progress, remaining durations, dependencies, or planning conditions change. During project execution, reviewing the critical path should be part of the regular status review process.
Yes. Crashing shortens activities by adding resources; fast tracking overlaps activities. A measure only shortens the project if it reduces the duration of the longest path or all equally long critical paths. Costs and risks must also be considered.
Classical CPM calculates the schedule from activity durations and dependencies. It does not automatically account for all resource limits or competing demands. Assess resource bottlenecks separately or use resource-constrained scheduling.
Yes, for example, when managing project-wide schedule constraints, integrations, external dependencies, or fixed release dates. CPM complements agile planning; it does not replace sprint planning or backlog prioritization.

Kai Sulkowski is an Online Marketing Manager at Projektron GmbH in Berlin. As an IPMA-certified project management expert, he focuses on project planning, schedule management, and the practical use of business software. Drawing on his extensive editorial and SEO experience, he explains methods such as the Critical Path Method in clear, practical terms.

How do individual tasks become a logically linked sequence of activities? Learn how to sequence activities, define dependencies, and lay the groundwork for a reliable schedule.
A complete project structure provides the foundation for planning. Learn how to divide your project into subprojects and work packages and present its scope clearly.

A theoretically feasible schedule still requires available staff and equipment. Learn how to check capacity, identify bottlenecks, and adjust your planning accordingly.

Which uncertainties threaten your project objectives? Learn how to systematically identify and assess risks and manage them with appropriate responses.
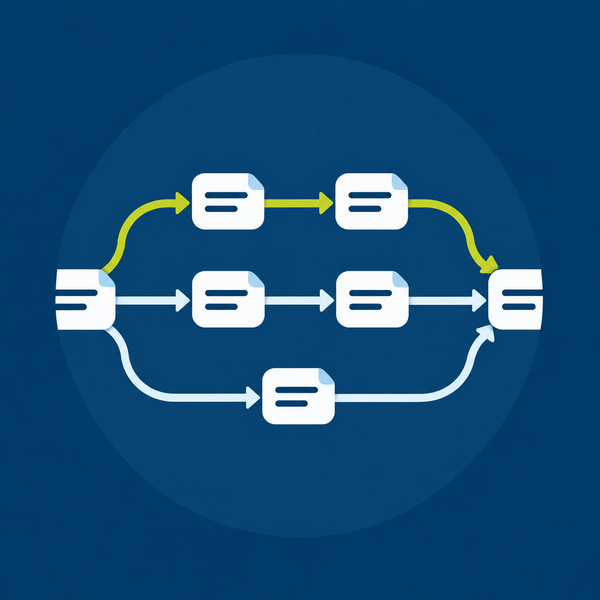
Symbolic project network diagram with three parallel activity sequences. The green route illustrates the critical path from project start to completion.