12/18/2023 - Articles
Creating a flowchart: Basics, methods and proven strategies
A project activity plan (PAP) or flowchart is an important part of the project plan. It is the basis for scheduling, the resulting timetable, the resource plan and the cost plan. But what does a flowchart or flow plan look like, what information does it contain and how do I create a flowchart? Here you can find out all this and receive a flowchart template as well as examples of the methodology for creating the flowchart as a list, precedence diagram and Gantt chart.
Contents:
- Definition: What is a flowchart?
- When should the flowchart be created?
- How is the flowchart presented? Task list, precedence diagram and Gantt chart
- Why create a flowchart?
- From the project flow plan to the project baseline
- Project workflow planning and scheduling with Projektron BCS
- All workflows in flow thanks to the flowchart
 visualizes the factual sequence of activities, events and interdependencies.")
Definition: What is a flowchart?
The term flowchart is often defined as follows: A flowchart or project activity plan (PAP) is the detailed time planning of a project, which includes the individual tasks, milestones, dependencies and resources and also shows the sequence of tasks, their estimated duration with start and end times. Here, however, there is a typical confusion between the flowchart and the project plan, which is to be understood as the totality of all existing plans in the project.

DIN 69901-5:2009-1 "Project management - Project management systems - Part 5: Terms" defines the term "flow plan" as follows:
Overview of the planned factual and possibly also temporal course of the project, oriented to the project objective, the realization conditions and the planned results.

The term "flow structure" is also defined there:
Representation of the elements (e.g. processes) of a flow as well as their temporal and logical (arrangement) relationships with each other
When creating a flow plan, the primary focus is on the factual process and only secondarily on the time schedule. The flowchart therefore represents the following:
| Activities (e.g. tasks, work packages, sub-projects) | |
| Events (e.g. milestones) | |
| Reciprocal temporal and logical relationships |
In practice, the estimation of the respective duration for the completion of the individual project tasks is usually also part of the process planning. However, the flowchart does not include dates for the start and end times of individual tasks or information on resource requirements. These are the subject of further planning steps.
When should the flowchart be drawn up?
The flowchart is created during the planning phase of a project. The project manager is responsible for creating it, but other team members may also be involved. The flowchart is part of the project plan, as is the previously created communication plan or the "plan of plans", the work breakdown structure (WBS). All subsequent planning steps, including the flowchart, are based on the WBS. The work breakdown structure defines the tasks to be completed in the project as part of the task or structural planning, i.e. the "WHAT" of the project.
 is the next logical step in the project planning phase after the creation of the work breakdown structure (WBS). It brings the planned project structure elements into a chronological sequence.")
This forms the basis for process planning, in which the order in which the tasks are to be completed is defined. The result is the project activity plan (PAP). Estimates of the duration of the individual work packages and tasks allow an initial estimate of the total project duration. The flowchart therefore answers the questions: WHAT happens in the project in WHAT order?
The next planning step involves scheduling the individual tasks with start and end dates and milestones and defining who is responsible for the work packages, sub-projects and tasks. The flow plan is created. In the subsequent personnel and resource planning, it is important to ensure that personnel, machines and materials are available at the required time. The final planning step is cost planning.
How is the flowchart presented?
A flowchart does not have a fixed form. It can therefore be realized with different representations. In practice, there are three main forms of presentation:
- Task list as a table
- Precedence diagram method (PDM)
- Gantt chart

1. Task list as a table
One option is to create the flowchart in a table in the form of a task list. In this way, it can be created quickly, easily and without specialized project planning software. It is based on the work packages or tasks from the previously created work breakdown structure and the activities from these work packages. Download our PDF flowchart template free of charge by clicking on the graphic on the right.
How to create a process list:
- Transfer work packages/tasks or activities from the work breakdown structure
- Add milestones (event with duration 0)
- Identify predecessors and successors
- Define relationships
- Show time interval
- Transfer to flow chart

Important: The duration and dependency of various tasks are not visualized in the task list and the critical path is not immediately apparent. For complex projects, a purely tabular representation therefore quickly becomes confusing. However, as a first step, the task list always provides a good basis for other forms of presentation of the flowchart.
Excursus: What are relationships?
Relationships describe the logical dependency of different activities. As a directed link, a relationship symbolizes a logical and temporal relationship between two planning elements in the precendence diagram. Predecessor-successor relationships are represented by arrows. There are four different types of relationships that are used in precedence diagrams or Gantt charts:
Normal sequence/ end-start relationship (NF/EA) | 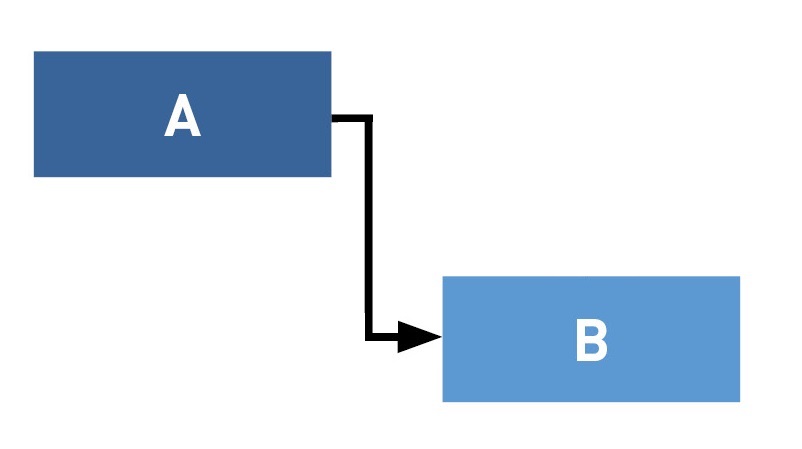 | B can only begin when A has ended. |
Start sequence/ start-to-start relationship (AF/AA) | 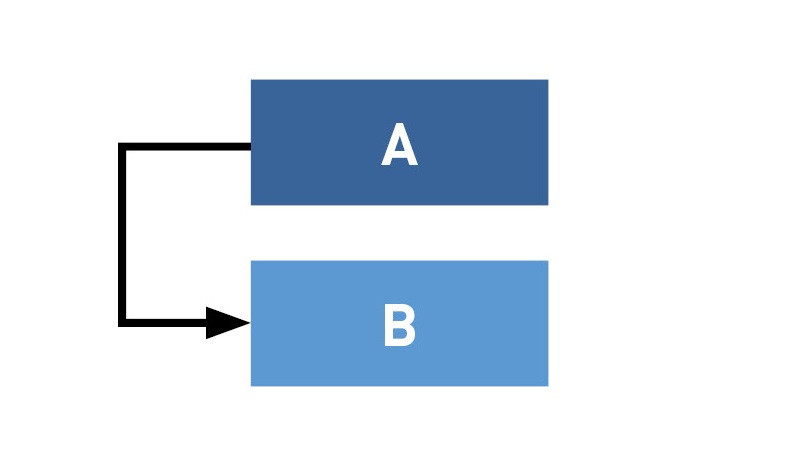 | B can only begin when A has begun. |
End sequence/end-end relationship (EF/EE) | 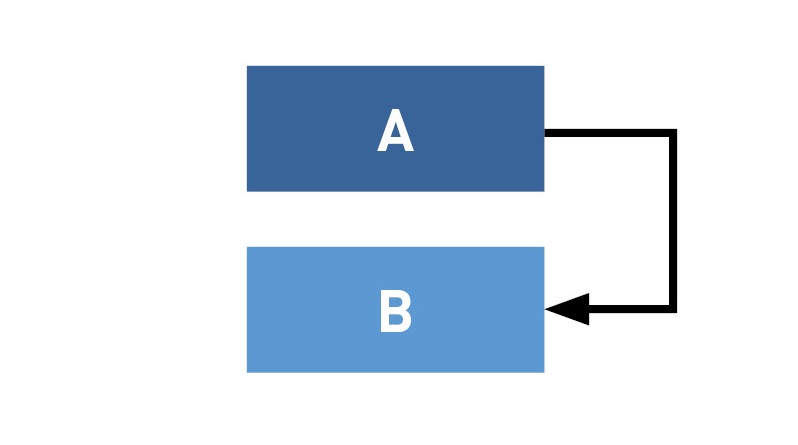 | B can only end when A has ended. |
Jump sequence/start-end relationship (SF/AE) | 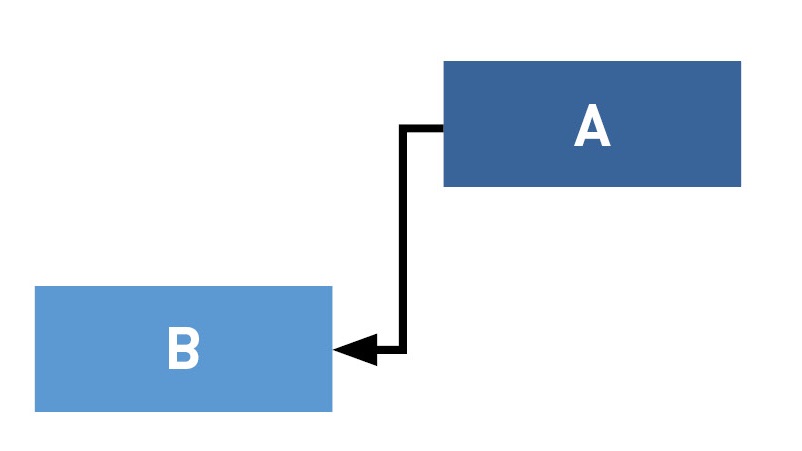 | B can only be completed when A has begun. |
2. Project schedule as a precedence diagram and the precedence diagram method (PDM)
Now transform the table into a logical sequence! A precedence diagram is used to represent individual activities in a project and their sequence structure, i.e. their duration and temporal and logical dependencies. The precedence diagram method (PDM) is a tool for scheduling activities in a project plan. It is a method of constructing a network diagram that uses boxes, referred to as nodes, to represent activities and connects them with arrows that show the dependencies. It is also called the activity-on-node (AON) method.
You can use the precedence diagram method (PDM) to create an overall precedence diagram for the entire project or a sub-diagram for one of the sub-projects.
What is a precedence diagram?
The precedence diagram graphically depicts all the activities of a project according to their dependencies and sequences.
With the precedence diagram method (PDM), you can calculate the earliest and latest start and finish times for the individual activities in the project using forward and backward calculation. This tells you how you can postpone work packages or activities and what impact this has on the overall project duration. In order to take a closer look at the free movement areas, there are buffers and the critical path in precedence diagram method (PDM).
- The free buffer (FB) is the time span by which an activity can be postponed without affecting the earliest position of other activities.
- The total buffer (TB) is the time span between the earliest and latest position of an operation. It therefore refers to the time by which the activities can be postponed or extended without postponing the end of the project and thus extending the project duration.
- The critical path describes the sequence of activities for which a postponement of the end date results in a postponement of the project end. It is therefore the sequence of activities with a total buffer of 0. The critical path is important management information, as activities on the critical path cannot be postponed without jeopardizing the end date of the entire project.
The advantage of the precedence diagram is that it can display the earliest and latest times, possible buffers and reserves for individual activities as well as the minimum project duration, which are relevant for subsequent scheduling. The critical path can be easily identified in the precedence diagram by specifying the buffers.
The precedence diagram is not based on a time direction from left to right and although the duration of the individual tasks is specified in the precedence diagram, it is not visualized using a time axis. This makes it difficult for project participants to understand. Each project activity is represented in the precedence diagram as a task node. This is a rectangle of standardized size. The data is usually written directly into the activity node, as the following project schedule example shows:

Calculating the precedence diagram manually is very time-consuming for extensive projects. From the first change in the flow plan, the previous calculation is also invalid and has to be carried out again. It is therefore essential to use a calculation program such as Excel or, even better, professional project management software to calculate the data in the precedence diagram economically.
The result of the precedence diagram:
| First draft of your schedule including project duration | |
| Information on how and how far activities can be postponed | |
| Time-critical activities and critical path are defined |
The precedence diagram therefore already fulfills all the requirements for scheduling. However, it is recommended that you first convert the precedence diagram into the Gantt chart format.
3. Flow plan presented as a Gantt chart (cross-linked bar chart)

The Gantt chart or bar chart is the most common and visually clearest form of presentation, as it allows you to easily display the absolute and relative duration of tasks to be processed in parallel and at different times. The Gantt chart can be derived from the precedence diagram or directly from the task list. Each task has its own line on the y-axis and is displayed with a bar corresponding to its duration. Milestones, the critical path of the project, the dependencies of the activities (relationships) and buffers can also be visualized clearly.
The presentation as a Gantt bar also offers you the advantage that you can easily develop your effort plan into a schedule by simply calendering the time axis of the chart. During project implementation, the progress of the project can be visualized very clearly in this form.
Why create a flowchart?
The flowchart is not simply a transitional stage from the work breakdown structure to the schedule/time plan. It is worth cultivating it as a separate planning step. Discover 3 key advantages of the flowchart:
1. Enables precise scheduling
The flowchart forms a solid basis for creating a precise timetable or schedule. With a flowchart, you can plan your project precisely in terms of time by setting milestones. Each milestone comprises tasks with associated subtasks. By breaking them down into smaller steps, you can estimate the time required to complete the tasks more realistically.
2. Processes and dependencies become apparent
A flowchart provides you and your project team with a comprehensive overview of all tasks and subtasks as well as their timing and responsibilities. Clear scheduling makes it clear which tasks are interdependent. This allows you to identify and resolve potential problems during implementation at an early stage. The flowchart therefore makes it easier for you to carry out your project efficiently and smoothly.
3. Transparency for all project participants
A flowchart ensures that every person involved is well informed at every stage of the project. This makes it clear to everyone what stage the project is currently at. This makes it easier to coordinate with colleagues about upcoming tasks and promotes effective collaboration. In addition, a flowchart helps to motivate the team, as progress and milestones achieved are clearly visible. This creates transparency and recognition for the work done, which increases the commitment and motivation of the team members.
From the project flow plan to the project baseline
It is worth investing the effort in creating a precise schedule, because now it is easy to create the project baseline. The schedule is created by simply calendaring the created flow plan, i.e. milestones are scheduled and the start and end times of processes are each given a date.
The milestone list from the phase planning is now given dates. The planning of the activities is adapted to the respective calendar conditions - a prerequisite for the subsequent resource planning. You have the best prerequisites for creating a schedule if you have already converted your flow plan into the form of a Gantt chart. The previously relative time specifications from the flow plan have been replaced by absolute time specifications after calendaring. The project baseline now answers the question: WHAT happens WHEN in the project and HOW LONG does it take?
A well-developed project baseline makes it easy to make adjustments and changes as the project progresses and to query the current project status on a specific date (e.g. as part of a status meeting or for the creation of a status report).
Project workflow planning and scheduling with Projektron BCS
The Projektron BCS project management software makes it particularly easy for you to create a flowchart for your project. In the "Work Breakdown Structure" view in the program, you can not only view, edit and filter the structure of your project from sub-projects, work packages, milestones and tasks, but also specify the processing time for each task. You can define the order of the structural elements simply by dragging and dropping.

YoYou can also specify the specific personnel resources required to complete a task or subproject in the “Effort plan” view. Thanks to automatic schedule calculation, Projektron BCS sums up the duration for project structure elements at higher levels from the bottom up. You can enter relationships in the tool as dependencies or multiple dependencies in fields specifically designed for this purpose, with additional buffers if desired. In the work breakdown structure, you can adjust the dependencies in the schedule again during subsequent scheduling.
BCS automatically creates a schedule for your project (deadline-oriented scheduling or resource-oriented scheduling for optimal resource utilization),
automatically calculates and visualizes the critical path, and
alerts you to inconsistencies and errors in your planning.
The display of your schedule as an interactive Gantt chart in Projektron BCS can be customized with just a few clicks and shows the critical path, project progress, dependencies between tasks, and even cross-project dependencies for your project. Edit the schedule easily by dragging and dropping the length of the bars in the Gantt chart.
You save the schedule and the resulting timetable in BCS together with the structure plan, the team plan, the effort plan and the cost plan in a base plan. This serves as a reference during project implementation in order to immediately recognize deviations from the actual status, e.g. delays in the project schedule or impending resource bottlenecks. You can also compare different baselines and save them as a template for future projects.
Use the comprehensive project planning functions of Projektron BCS to automate your planning processes, reduce planning effort and avoid errors - no matter which project management method you use. See for yourself and test Projektron BCS now, free of charge and without obligation.
All workflows in flow thanks to flowchart
A flowchart or project activity plan (PAP) is an essential component of the project plan. It is the logical next step after the creation of the work breakdown structure by placing all WBS elements in a chronological order and arrangement relationship. The flowchart thus forms the basis for precise time planning by firmly defining and visualizing the processes and dependencies, duration and buffers of all activities in the project.
The flowchart also increases transparency for all project participants, as progress and milestones achieved are visible. This promotes collaboration and increases motivation within the team. The Gantt chart in particular proves to be a visually clear form of presentation.
Overall, creating a flowchart is a worthwhile step that contributes to the successful implementation of a project. With a specially developed product such as Projektron BCS, you can easily create precise flowcharts, as you benefit from storable templates, automatic calculations, the display of the flowchart in different view variants and automatic error corrections. The project management software takes care of scheduling the project schedule and creating a timetable for you.
We hope you achieve your goal and wish you every success in creating your flow plan!

About the author
Like all other departments at Projektron GmbH, the marketing department also uses the possibilities of the Projektron BCS project management software to deploy its resources in a targeted manner and implement projects efficiently. Kai Sulkowski is an editor in the marketing department, certified according to IPMA and always informed about current developments and innovations from the world of project management.
Weitere interessante Artikel im Projektron-Blog
FAQ – Project schedule and project planning
What is a project schedule?
A project schedule shows the chronological and logical sequence of tasks within a project. It visualizes which work steps are dependent on each other and helps you to better coordinate appointments and deadlines. This allows you to maintain an overview of the project phases and their sequence at all times. In addition, potential bottlenecks or critical paths can be identified at an early stage. A project schedule is therefore an important tool for managing projects in a transparent and structured manner.
How do I create a project plan?
To create a project plan, first define the project goals, tasks, and resources required. Then determine the chronological order and duration of the individual work steps. It is helpful to structure the task packages and set milestones to regularly check progress. Tools such as Projektron BCS or other project management software make the creation and maintenance of the project plan particularly convenient thanks to ergonomic wizards. Finally, you should coordinate the project plan with all project participants and update it regularly.
How do I develop a project plan?
The development of a project plan begins with the project goal definition and the division of the project into work packages. You then arrange these work packages in a logical order in terms of content and time and assign responsibilities. It is particularly important to also plan for resources and their availability. You should also take critical deadlines and project milestones into account. Software support, such as Projektron BCS, helps you to make changes and progress transparent at all times.
What is a schedule?
A schedule represents the logical and chronological sequence of work steps within a process or project. It shows what needs to be done sequentially or in parallel. The schedule helps you to better understand the interrelationships between activities and allocate resources sensibly. It also allows you to identify risks and time buffers. This makes the schedule a simple but very effective tool for planning and control.
What are typical milestones?
Milestones are fixed points in time or results in a project that mark important progress. They help you structure the project and monitor the achievement of objectives. Typical milestones could be the start of the project, the completion of the planning phase, or the successful testing of a project result. Milestones give everyone involved an overview and allow you to react early if deadlines are at risk. They also make progress visible and motivate the project team.
What is a project plan?
A project plan is a comprehensive document that structures all aspects of your project: the tasks, the schedule, the resources, and the responsibilities. It provides you and your team with guidance and transparency at all times. With a project plan, you can keep track of deadlines and dependencies and identify risks early on. The project plan also serves as the basis for ongoing project management and communication with stakeholders. A well-maintained project plan helps you to implement your project successfully.
When is the project structure plan created?
The project structure plan is created at the beginning of project planning, after the project goals have been clarified. It helps you to break down the project into logical and manageable work packages. On this basis, the individual elements can then be scheduled in terms of time and personnel. The earlier the project structure plan is available, the better risks and costs can be estimated. It also creates transparency and a common understanding among all project participants.
How do I create a schedule?
To create a schedule, collect all the tasks in your project and estimate how long they will take. Then determine the order in which the work will be done, taking into account any dependencies. It is particularly important to allow for buffer times and possible risks. You can visualize your schedule clearly with a Gantt chart or the project management software of your choice, such as Projektron BCS. This allows you to keep track of appointments and deadlines at all times.
What is a network plan and how do I create one?
A network plan is a graphical representation of the logical sequence and time dependencies of the work in a project. It shows which tasks must be completed in parallel or one after the other and which is the critical path. Network plans thus provide you with a solid basis for decision-making to control project deadlines. In addition, buffer times and bottlenecks can be easily identified. You create a network plan by listing the work packages of your project and defining their sequence and mutual dependencies. You then link the work steps graphically with arrows so that the project flow becomes visible. This allows you to easily identify critical paths and buffer times. Network plans are particularly suitable for complex projects with many dependencies. Project management software helps you automatically calculate and visualize network plans.
What is a master plan?
The term “master plan” is more of a practical and general term used in project and business management. Official methods such as PMI, PRINCE2, or IPMA do not use it as a technical term, but instead work with project plans, baselines, baseline plans, and roadmaps, which serve the same purpose. A master plan is an overarching plan that describes the long-term goals and strategies of a project or company. It gives you and your team direction and helps you prioritize individual projects and measures. The master plan also helps to divide large and complex projects into phases and intermediate goals. This creates clarity and a reliable framework for all subsequent detailed planning. It sets the direction and the major milestones, but does not yet specify detailed individual tasks. A master plan is therefore the compass for the entire project work.

Create a project schedule: We show you how to do it and why it is important for project planning.